As published in Expert Witness Journal.
Many of us in the world of construction are aware of the term ‘disruption’, but what does it actually mean?
In the UK, the SCL Protocol1 describes disruption as “a disturbance, hindrance or interruption to a Contractor’s normal working methods, resulting in lower efficiency.”
And in the United States, the AACEI Recommended Practice note provides a list of some common types of disruption that can be experienced on engineering and construction projects2. These include:
| Absenteeism | Labour relations |
| Acceleration | Learning curve |
| Adverse weather | Materials and equipment shortages |
| Availability of skilled labour | Overmanning |
| Changes and rework | Poor morale |
| Competition for trade labour | Out of sequence working |
| Labour turnover | Site or work area restrictions |
| Crowding/stacking of trades | Site conditions |
| Defective work | Untimely approvals or responses |
| Dilution of supervision | |
| Excessive overtime | |
| Failure to coordinate trade contractors | |
| Fatigue |
This is by no means an exhaustive list, and I am sure that you will be able to come up with several more.
Is There Disruption To The Works?
In 2023, a survey in the United States found that 45% of contractors experienced a decline in productivity3.
The survey found that some of the top causes of productivity issues included poor planning and communication, poor site logistics management, poor-quality drawings and specifications, and change-order inefficiencies.
To be able to consider and quantify the effects of disruption, it is necessary to first determine that disruption has in fact taken place or that the project is currently being disrupted.
Spotting disruption is easy, right?
Well, maybe not so easy. The clue to disruption lies in those last four words of the SCL’s definition: “resulting in lower efficiency” – that is to say, lower productivity.
When carrying out its regular progress update, a contractor might find that it is on programme – there is no delay or disruption – so all is good with the world. Well, that may not be strictly correct.
Consider this. What if the contractor had planned to install 100m of pipework per week and the progress update showed that it had in fact installed 100m of pipework per week? Traditionally, that would be the end of the story. However, what if the planned work was to be carried out using a single two-person team, but instead, two teams actually completed the work, a total of four people, not two?
In this situation, the planned production was achieved, but productivity was not.
What is often not appreciated across the industry is the subtle difference between production and productivity. Production is a measurement of output, whereas productivity measures the labour hours required to achieve a unit of output.
How Do We Value Disruption?
There are several ways of assessing disruption. The SCL Protocol provides a summary table of the more common methods of measuring disruption4
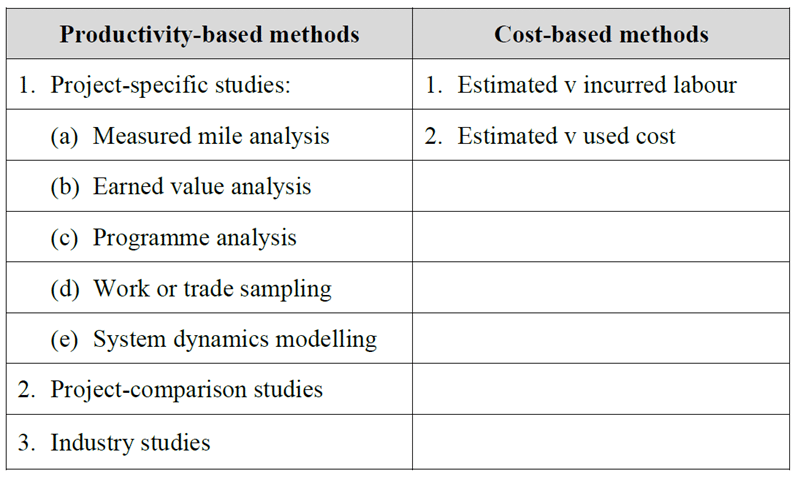
It describes the productivity-based methods as being the preferred methods, and they are listed in order of preference. The cost-based approach is considered to be the least robust and is mostly used when lost productivity cannot be reliably calculated.
Cost-based methods generally rely on comparing actual and estimated costs.
Among the productivity-based methods, the measured mile is probably the most talked about. A reason for this is perhaps that it is very easy to understand. It requires the analyst to compare actual production during an uninterrupted period of work to the production rate achieved during a disrupted period.
The measured mile is very good; however, as with most methods, it does have its limitations. A limitation which is often discussed is that it requires the analyst to ‘find’ a piece of the same or similar work that has not been disrupted. Having done that – and this is not as easy as it sounds, by the way – the undisrupted period must be over a reasonable length of time to confidently determine a trend.
Another problem might be the identification of disruption taking place. In my pipework installation example, the measured mile would show that production is being achieved, therefore there is no disruption – it does not automatically identify lower productivity.
A better option, particularly during the ‘live’ works, might be an Earned Value calculation.
What is Earned Value?
Earned value (generally referred to as Earned Value Analysis ‘EVA’ or Earned Value Management ‘EVM’) is a technique used in project management to measure performance of a project.
The analysis combines the project budget and the programme to determine the value of work that has been completed to date. It can be applied across the entire project, specific sections of work, or selected activities.
A simplified EV equation is: EV = % of work completed x budget
The EV method compares ‘earned’ hours (derived from the budget) with actual hours to complete the work (EVA). The difference is then used to determine any productivity loss and the productivity (or performance) factor (‘PF’).
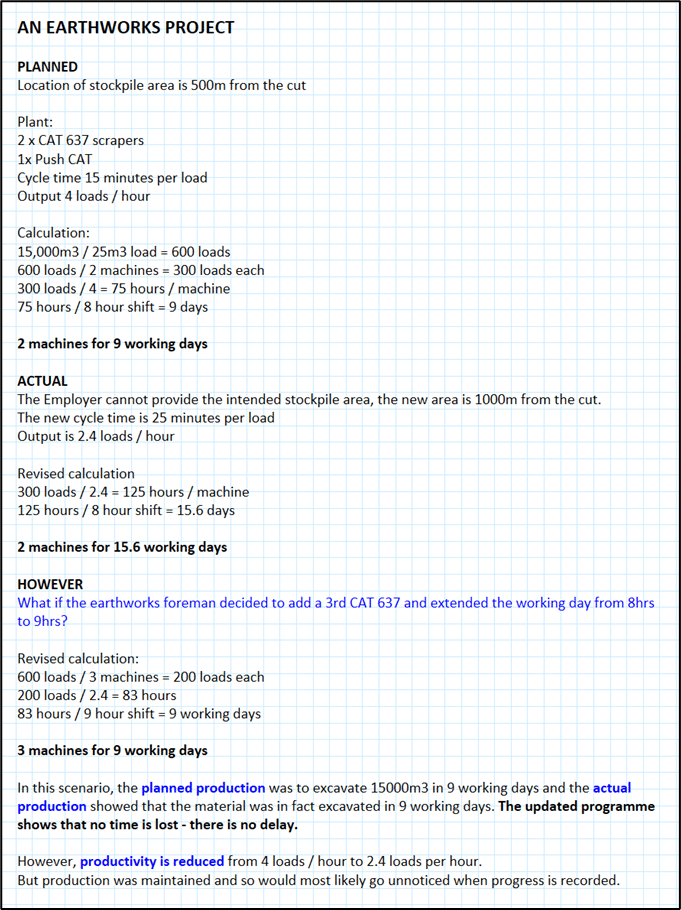
Using the earthworks example:
• The contractor budgeted that it would take 144 machine (CAT637) hours to move 15,000m3 of material to the stockpile. This is the Earned Value for this work.
• If 72 machine hours have been recorded to date, then the EV method estimates that 50% of the work has (or should have been) completed.
• If the contractor has actually spent 243 machine hours to complete the work, then 99 machine hours are measured as lost productivity (144hrs – 243hrs = -99hrs).
• The productivity factor is calculated by dividing the earned hours by the actual hours: 144 / 243 = 0.59
This is a 41% loss in productivity.
If the contractor is able to carry out these calculations early enough in the programme, it has the opportunity to make informed decisions with regard to improving the productivity factor, this is Earned Value Management.
Establish Causation
Having determined there has been a loss of productivity – and therefore higher costs – the next step is to establish the cause of the loss. In the earthworks example, the cause was the change of the stockpile location. The Employer was to provide an area of land for the stockpile, but once the project commenced, the location was not available, and an alternative was provided.
This is quite straightforward but, what if the contractor’s planned outputs and resulting budget was over ambitious in the first place?
What if the contractor always required 3 machines to carry out the work, but only based its tender on 2 machines?
I expect many of you will have been in a tender finalisation meeting where the director ‘requests’ that time, money, or both, be ‘stripped’ out of the ‘realistic’ tender programme and sum to win the work! I know I have!
It may be that the Employer change did cause a loss of productivity, but this was further exacerbated by the contractor’s own culpable performance.
Performance Analysis
What I have described so far is about recognising issues with productivity to help in recovering additional costs where it is appropriate to do so, and as such, it is often carried out after the event – indeed, it is often an afterthought and only recognised once the contractor realises it has lost money on the project. However, performance analysis is also a helpful and transparent tool to help manage and deliver the project.
When the project programme is updated, it is normal to record current progress (% complete) up to the date of updating. The programme is then rescheduled, and the completion date is forecast.
This approach – which is common practice – assumes the remaining work will be completed within the planned remaining durations.
However, a question to be asked is how long did it take to achieve the current work completed?
For example:
Activity 1 has a duration of 20 working days.
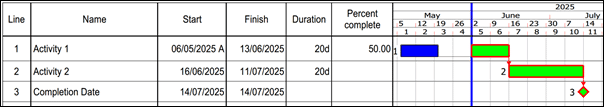
After 4 weeks, the programme is updated, and a measure of the work shows that 50% of Activity 1, which started on 06 May, has been completed.
The planner enters the data into the programme and reschedules it.
The forecast effect is that Activity 1 will finish on 13 June, and the project will be completed 2 weeks late.
However, a closer look at the critical driving activity tells us that the contractor has taken 18 working days to achieve 50% of the work, which was planned to take 10 working days.
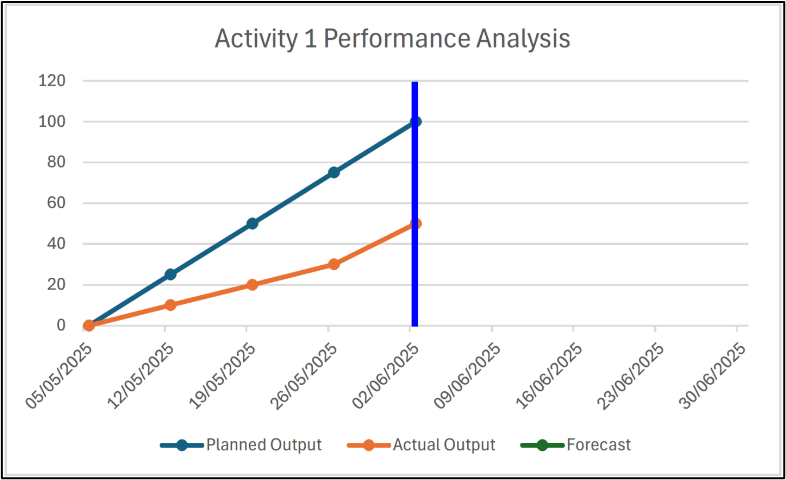
If we compare the actual productivity
to the planned, we can better
visualise the performance achieved
for Activity 1.
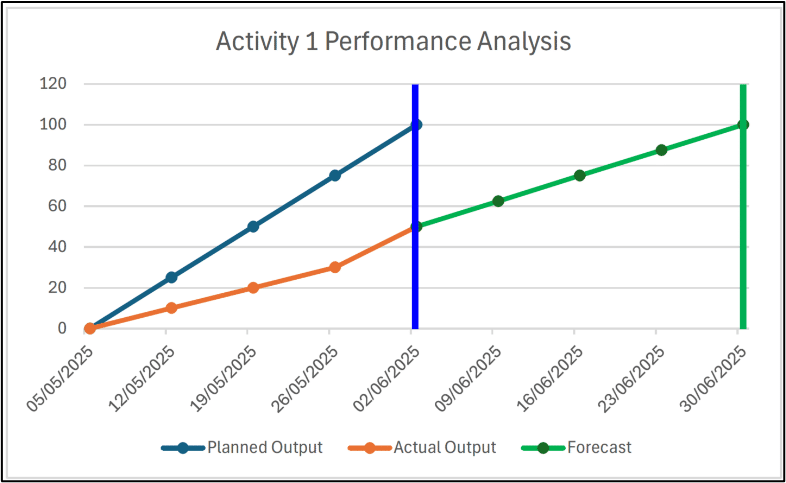
Using the average productivity rates
to date we can forecast the finish
date for Activity 1, which in this
example, is 30 June.
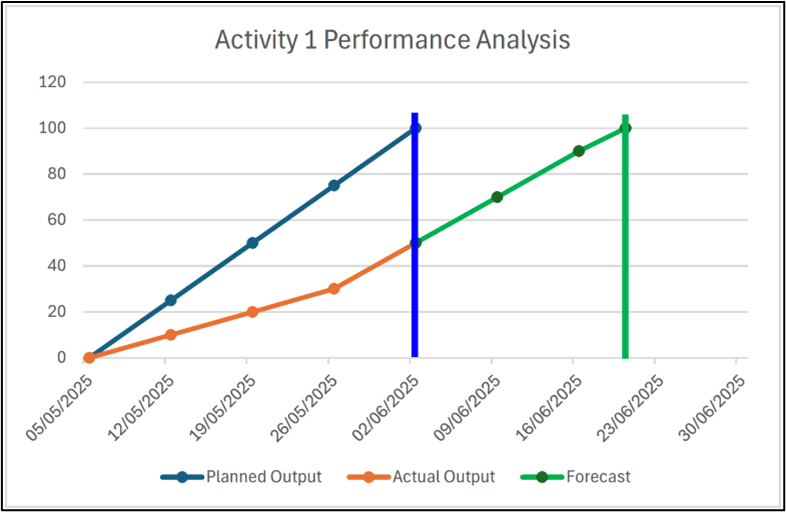
However, the performance achieved
line shows an improvement in the
week immediately before the update.
If this improved rate continues, the
forecast finish date for Activity 1 is
20 June.
I am not saying the programme update is obsolete, far from it, it is the programme that identifies the starting point for the analysis.
Activity 1 in this example is a driving critical activity, therefore any delay to it has a direct equal effect on the completion date for the whole project. Having the performance data available and presented in a simple format, such as these graphs, the project team is better equipped to make informed decisions and potentially take corrective actions.
Why is productivity down? Do we continue as we are? Was the improvement a blip? Can we improve and mitigate?
Back in my time as a project planner, I was lucky enough to be site-based full-time. This made it easy for me to actively monitor the programme and the performance. I realise in today’s world, having a full-time planner may be a luxury that the contractor cannot afford in terms of cost or simple availability. But that does not prevent the site team from carrying out the performance monitoring. It does not need to have a full-blown EVA technology system; a simple Excel spreadsheet (or even pen and paper) will also do the trick. It is more about recognising the problem and doing something about it.
A Final Thought
I would suggest to anyone reading this article that, having reached its end, it might be a good time for some inward review. Ask yourself and your team: if you were now tasked to prepare a disruption claim, could you? Are the records of a suitable level of detail? Indeed, stepping back a little further: do the records even exist?
And if you’re on a live project that is currently on programme, is your productivity what it should be or is there a large bill looming for increased labour costs?
About The Author
David Waddle is a Regional Director and Construction Expert Witness with more than 40 years of experience in civil and building engineering. He has worked on major UK projects both as a site‑based planner and project manager, as well as a delay and construction management consultant.

David Waddle, FCIOB, FAPM, AMICE, MCIArb
Regional Director, Delay and Construction Expert Witness
+44 77 8034 1583
[email protected]
View Expert Profile
References
- Society of Construction Law ‘Delay and disruption Protocol’ 2nd Edition (2017), paragraph 18.1. ↩︎
- Association for the Advancement of Cost Engineering (AACE) International, Inc., ‘Estimating lost labor productivity in construction claims, AACE International Recommended Practice No. 25R-03’ [2004]. ↩︎
- FMI Labor Productivity Study 2023. ↩︎
- Society of Construction Law ‘Delay and disruption Protocol’ 2nd Edition (2017), paragraph 18.13. ↩︎