Failure Analysis of a Race Car Transmission Input Shaft

Background

A 300M ultra-high strength steel transmission input shaft fractured during a NASCAR race after approximately 254 miles. A metallurgical failure analysis was performed by the Rimkus Materials Testing and Investigation team to evaluate the cause of the fracture.

Services Provided

The fractured input shaft was subjected to a series of testing and analytical techniques including visual and stereoscopic examinations, scanning electron microscope (SEM) examinations, metallography/microstructure evaluation, chemical composition analysis, and Rockwell hardness testing.

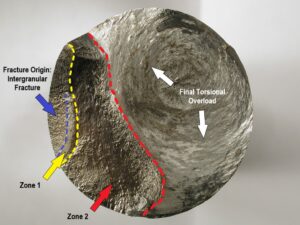
Results of the testing indicate the fracture occurred due to fatigue progression from an intergranular stress crack that initiated at a dot peen identification marking on the shaft. The dot peened engraving creates a high stress concentration in the hard surface (54 Rockwell C – HRC) of the shaft. A shallow zone of intergranular fracture was observed, which initiated at the bottom of the dot peened lettering on the shaft. Prior to the final torsional overload failure of the input shaft, two events of fatigue progression were observed to be covering approximately 33% of the fracture surface. Intergranular cracking at the initiation site indicates a brittle surface condition, which may be an indicator of excessive residual stress on the surface of the shaft.

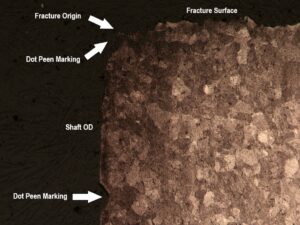
Metallographic analysis of the fracture revealed secondary, incipient intergranular cracking at the bottom of adjacent dot peen marked lettering. No unusual conditions were observed in the martensitic microstructure of the shaft.

Chemical composition analysis of the input shaft material confirmed the shaft was manufactured from 300M, ultra-high strength, alloy steel. No unusual conditions were observed in the composition.

The high hardness (HRC54) of the 300M shaft makes the component highly notch sensitive with very little ductility. The dot peen marked lettering provided a notch effect and stress riser location for fracture initiation.

Photos
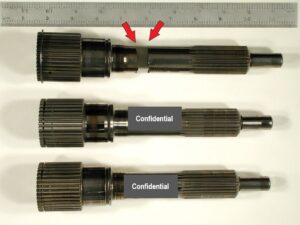
An overview of the fractured input shaft (top) and two comparison shafts that had undergone similar racing conditions.
Figure 1: An overview of the fractured input shaft (top) and two comparison shafts that had undergone similar racing conditions.


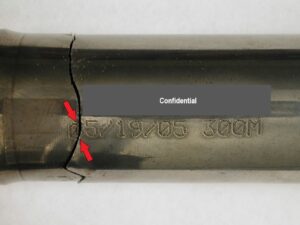
A close-up view of the fractured input shaft. The fracture crosses the "0" in the date code stamp on the part (arrows).
Figure 2: A close-up view of the fractured input shaft. The fracture crosses the “0” in the date code stamp on the part (arrows).


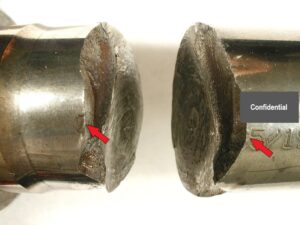
A low angle view of the fractured input shaft points to the fracture origin at the dot peened "0" in the date code.
Figure 3: A low angle view of the fractured input shaft points to the fracture origin at the dot peened “0” in the date code.


A close-up view of the fracture surface shows the fracture origin at a brittle intergranular zone (blue arrows). Two fatigue zones were observed to be propagating over approximately 33% of the fracture surface prior to final torsional overload, as well as fatigue arrest marks and oxidation noted in fatigue zone 2.
Figure 4: A close-up view of the fracture surface shows the fracture origin at a brittle intergranular zone (blue arrows). Two fatigue zones were observed to be propagating over approximately 33% of the fracture surface prior to final torsional overload, as well as fatigue arrest marks and oxidation noted in fatigue zone 2.


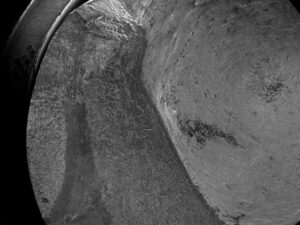
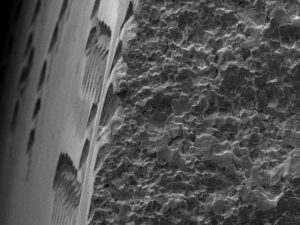
A low magnification SEM view shows the fracture surface in the region of fracture initiation.
Figure 5: A low magnification SEM view shows the fracture surface in the region of fracture initiation.


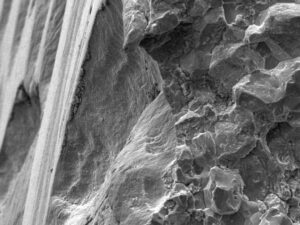
An increased magnification SEM view shows there is intergranular fracture, which is indicative of a high hardness, brittle condition at the fracture origin.
Figure 6: An increased magnification SEM view shows there is intergranular fracture, which is indicative of a high hardness, brittle condition at the fracture origin.


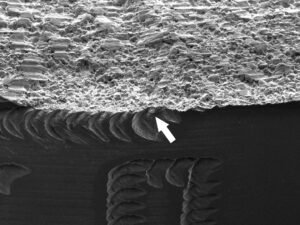
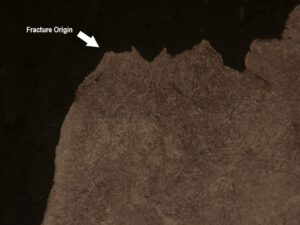
A high magnification SEM view of the fracture origin indicates the fracture initiated at the bottom of a dot peen indentation on the shaft OD surface.
Figure 7: A high magnification SEM view of the fracture origin indicates the fracture initiated at the bottom of a dot peen indentation on the shaft OD surface.


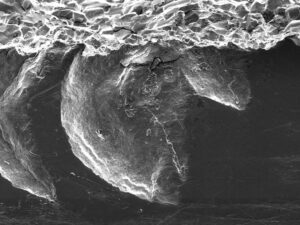
An increased magnification SEM view of the fracture origin indicates the fracture initiated at the vertical line of the "0". The brittle, intergranular region, adjacent to the fracture initiation site, is observed.
Figure 8: An increased magnification SEM view of the fracture origin indicates the fracture initiated at the vertical line of the “0”. The brittle, intergranular region, adjacent to the fracture initiation site, is observed.


A high magnification SEM view of the fracture origin is observed at the vertical "0".
Figure 9: A high magnification SEM view of the fracture origin is observed at the vertical “0”.


An optical microscopic image of a longitudinal cross-section through the fracture origin shows an impression in the surface at the fracture origin, which is the result of dot peen marking. An additional impression is observed below the fracture origin.
Figure 10: An optical microscopic image of a longitudinal cross-section through the fracture origin shows an impression in the surface at the fracture origin, which is the result of dot peen marking. An additional impression is observed below the fracture origin.


A high magnification optical microscopic view of the longitudinal cross-section at the fracture origin exhibits evidence of brittle intergranular fracture. No unusual conditions are observed in the martensitic microstructure.
Figure 11: A high magnification optical microscopic view of the longitudinal cross-section at the fracture origin exhibits evidence of brittle intergranular fracture. No unusual conditions are observed in the martensitic microstructure.